———— Time:2022-12-29 Edit: Number of times read:73 ————
Recently, China Customs announced the sub-item data of grain imports. In the first 11 months of 2022, China imported 133 million tons of grain, a year-on-year decrease of 11.8%, accounting for 19% of China's total grain output in 2022. According to the current import speed, it is estimated that the annual grain import scale will reach 145 million tons, a slight decrease of about 15 million tons compared with last year's import volume.
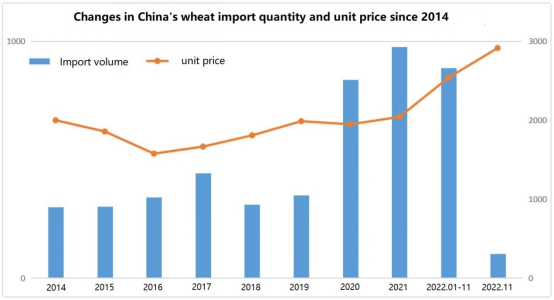
According to historical data, before 2020, China's total annual wheat imports were about 3-4 million tons. However, after the total amount of wheat imports exceeded the 8 million tons mark for the first time in 2020, it has been above 8 million tons for three consecutive years.
At the same time, the unit price of China's wheat imports has continued to rise. In the past November, the average unit price of wheat imports has approached RMB 3,000/ton, which is about 1.5 times the previous normal year.
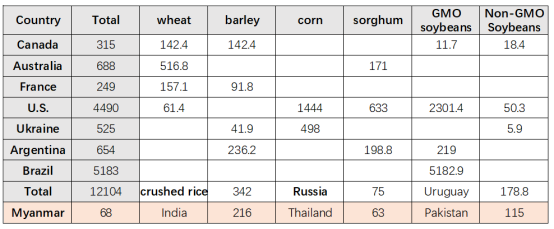
At present, the main sources of China's wheat imports are Australia, Canada and France, while the amount of wheat imported by the United States has dropped sharply this year.
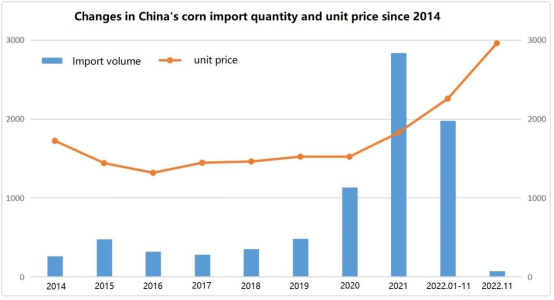
In the corn market, this change is more obvious. Data show that since China became a net importer of corn in 2008, the annual import level has remained between 2 million and 4 million tons, but it will soar to 11.3 million tons in 2020. The total import volume from January to November this year has reached 19.75 million tons.
In terms of price, the average import price of corn in China was about RMB 1,700/ton in 2014, and the current import unit price of corn per ton is also approaching about RMB 3,000.
At present, the main sources of China's corn imports are the United States and Ukraine, but the latest news shows that corn from Brazil will increase significantly in the future.

Relatively, the fluctuation of rice imports is small, but the imports in the past two years have also shown a relatively large growth trend. As of now, China's total corn imports from January to November have reached 5.78 million tons. Although the increase in imports is not large, it has made rice imports break through the tariff quota limit for the first time this year.
In terms of the unit price of imports, the unit price of rice imports in November was about RMB 3,300/ton, which was not much different from the average level in previous years. The average import price in the first 11 months was RMB 2,550, which was at a low level this year. This may be related to the increase in China’s rice imports in recent years. It is related to crushed rice with a lower unit price.
Up to now, China's rice imports are basically dominated by Southeast Asian countries, but the export of crushed rice from India and Pakistan to Chinese rice has grown rapidly.
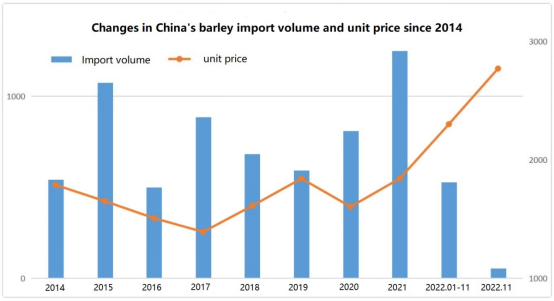
Next, look at the barley market. As a substitute for corn, barley has been imported in large quantities since 2009. The current annual import level remains between 5 and 8 million tons. Before 2020, it will be dominated by Australian barley. In the past two years, barley imports have mainly come from France, Canada, Ukraine and Argentina.
In terms of unit price of imports, the unit price of barley imports also showed a sharp rise. As of now, the unit price of barley imports in China is about RMB 2,750/ton.
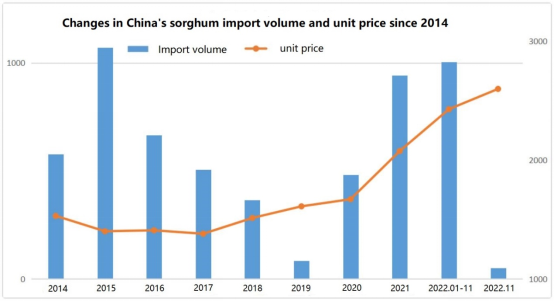
Imports of sorghum also began in 2009, when domestic buyers began to look for substitutes around the world as China’s domestic corn supply and demand became unbalanced. Judging from the scale of sorghum imports in recent years, it has fluctuated greatly, and has remained at a level of about 10 million tons in the past two years.
At present, China's sorghum imports mainly come from the United States, and the unit price of imports is about RMB 2,600/ton.
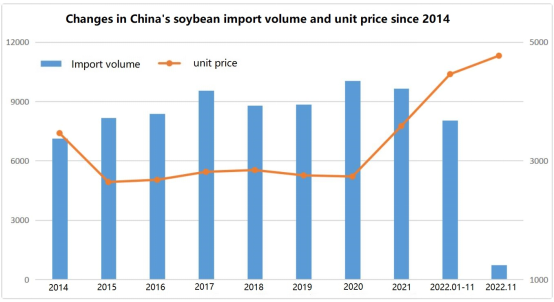
Finally, let's take a look at soybeans, the most important variety of China's grain imports. Soybean imports still show a trend of increasing year by year. However, if we take a long-term view, the growth rate of soybean imports has slowed down significantly in the past five years, which is related to the fact that China's feed farming industry has reached a phased peak.
From the point of view of the unit price of imports, the unit price of soybean imports has also shown a steady upward trend. Up to now, the direct import cost of soybeans has risen to RMB 4,700/ton.
At present, China's soybean imports are still dominated by Brazil and the United States.
In other aspects, due to the continuous growth of China's corn demand in recent years, domestic corn has been difficult to meet the demand, and China is seeking a large number of substitutes in the international market. In addition to barley, sorghum and crushed rice, cassava imports from Southeast Asia have also been carried out in recent years. .
It is reported that the current price of imported cassava has also risen to a high of RMB 2,200. Previously, the price of this variety was mostly concentrated in the hundreds of yuan.
In addition, the import of DDGS in the United States is also worthy of attention. At the beginning of this year, China’s Ministry of Commerce initiated an expiry review investigation of the anti-dumping measures applied to DDGS originating in the United States. The subsidy investigation period for this review is from July 1, 2020 to June 30, 2021, and the industrial damage investigation period is from January 1, 2017 to June 30, 2021. This survey started on January 12, 2022 and should end before January 12, 2023.
Previously, China imported 6.8 million tons of U.S. DDGS in the highest year.